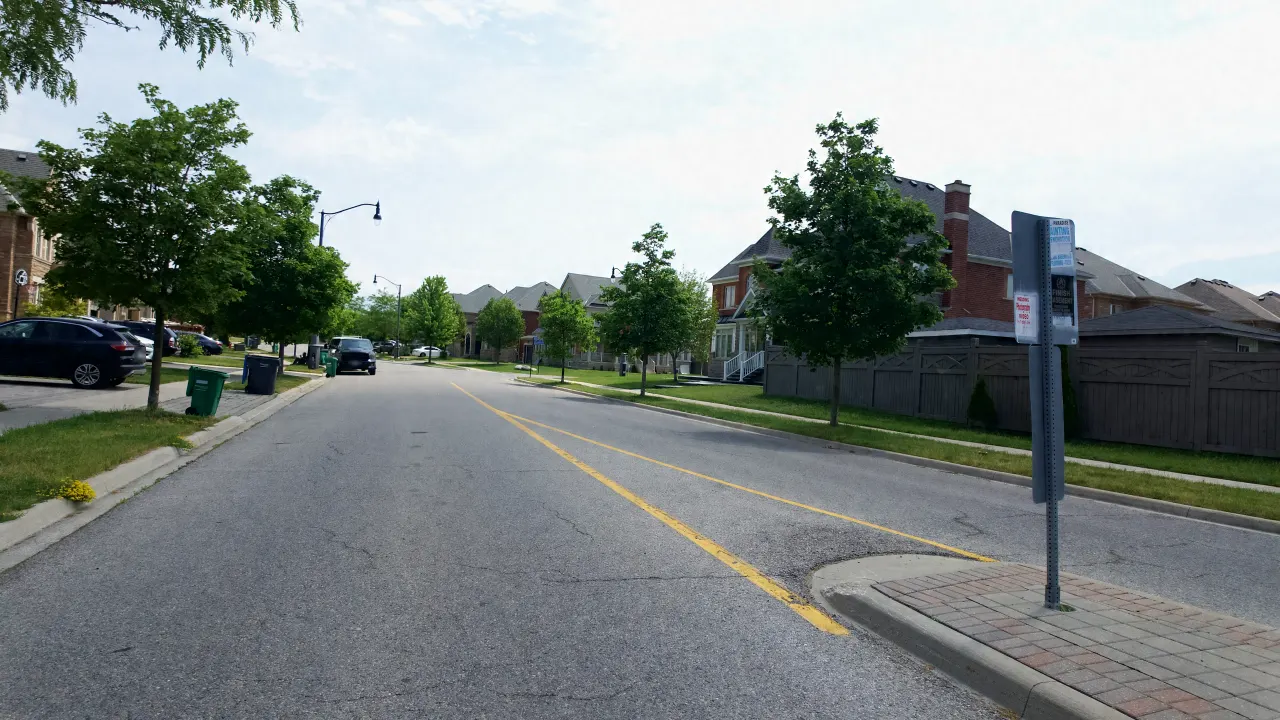
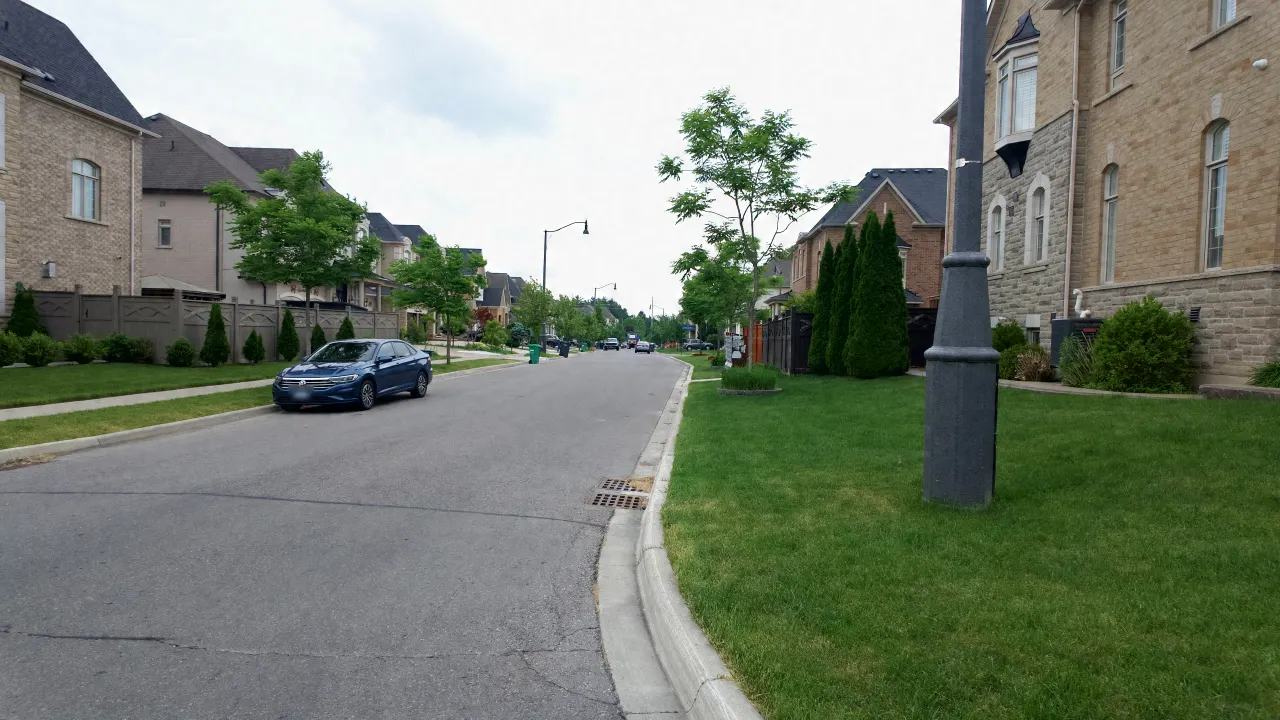
Estates of Credit Ridge · Street Guide

Cannington Crescent

  • 36 Homes
  • 1 For sale
  • 0 For lease
Asking prices from $1,699,999
Get alerts for Cannington Crescent
Active Listings

Homes for Sale or Lease on Cannington Crescent

1 for sale

View All Listings
Street Facts

Living on Cannington Crescent

  • City Ward Ward 5
  • Garbage & Recycling Day Thursday, Zone B
  • Nearest Transit Stop Royalwest Dr s/of Beachville Cir · 3 min walk Route 60

Street facts contain information from the City of Brampton, Region of Peel, and Brampton Transit, licensed for reuse. Figures are a point-in-time snapshot and may change. Verify collection days, routes and safety zones with the relevant authority before relying on them.

Sales History

What Homes Have Sold for on Cannington Crescent

3 recorded sales on this street. Create a free account to see sold prices.

Or contact Harpreet directly for a sold price discussion.

Market History

Market history on Cannington Crescent

MLS® records since 2010 show 53 sale listings and 19 sales on Cannington Crescent, a street of 36 homes. Sellers on this street closed a sale on 70% of attempts, against 72% across Estates of Credit Ridge. Homes have sold at a median 97.9% of their final list price, with 21% going over asking; the neighbourhood median is 97.5%.

A sold listing here spent a median 14 days on the market; from the first listing of an attempt to the firm sale took a median 43 days. 32% of sales came after at least one relisting. 31% of the homes on Cannington Crescent changed hands in the last 10 years, close to the 29% neighbourhood rate. Homes that sold more than once since 2010 resold a median 3.6 years apart. In the last 12 months, 2 homes sold on Cannington Crescent and 1 came off the market without selling.

  • Sell-through since 2010 70% Estates of Credit Ridge: 72%
  • Median days on market 14 Estates of Credit Ridge: 17
  • Sale to final list price 97.9% Estates of Credit Ridge: 97.5%
  • Sold over asking 21% Estates of Credit Ridge: 18%
  • Relisted before selling 32% Estates of Credit Ridge: 45%
  • Changed hands, last 10 years 31% Estates of Credit Ridge: 29%
  • Years between resales 3.6 Estates of Credit Ridge: 3.9
Cannington Crescent by period
Period Sold Did not sell Sell-through Median days on market Sale to list Median price
2010 to 2014 2 2 – – – –
2015 to 2018 7 1 88% 13 98.8% $1,135,000
2019 to 2022 5 1 83% 2 105.6% $1,980,000
2023 to 2026 YTD 5 4 56% 25 96.4% $2,250,000
Last 12 months 2 1 – – – –
Year by year on Cannington Crescent (5 years with enough records)
Cannington Crescent by year
Year Sold Did not sell Sell-through Median days on market Sale to list Median price
2014 2 1 – – – –
2015 3 0 – – – –
2022 2 0 – – – –
2025 1 2 – – – –
2026 YTD 2 0 – – – –

A dash means fewer than 5 records in that group, so the figure is not shown. A home relisted within 90 days counts as the same attempt to sell; "did not sell" counts attempts that ended with no sale and no relisting. Prices are medians rounded to the nearest $5,000. Figures as of October 16, 2026.

Based on data from the Toronto Regional Real Estate Board. Analysis by Harpreet Sandhu, Broker.

Street Alerts

Watch Cannington Crescent

Get an email when something changes on this street, sent as it happens or as a daily summary.

  • New listings for sale or lease
  • Price changes
  • Sold and leased results (members)
  • Instant, daily or twice-daily emails

Your email carries into account setup · No spam · Unsubscribe anytime

Nearby Schools & Parks

Straight-line distance from here. Not a statement of school catchment or zoning; always verify assignment with the applicable board.

Schools

Parks

City Road Data

The Road on Cannington Crescent

Measured only along the part of Cannington Crescent inside Estates of Credit Ridge.

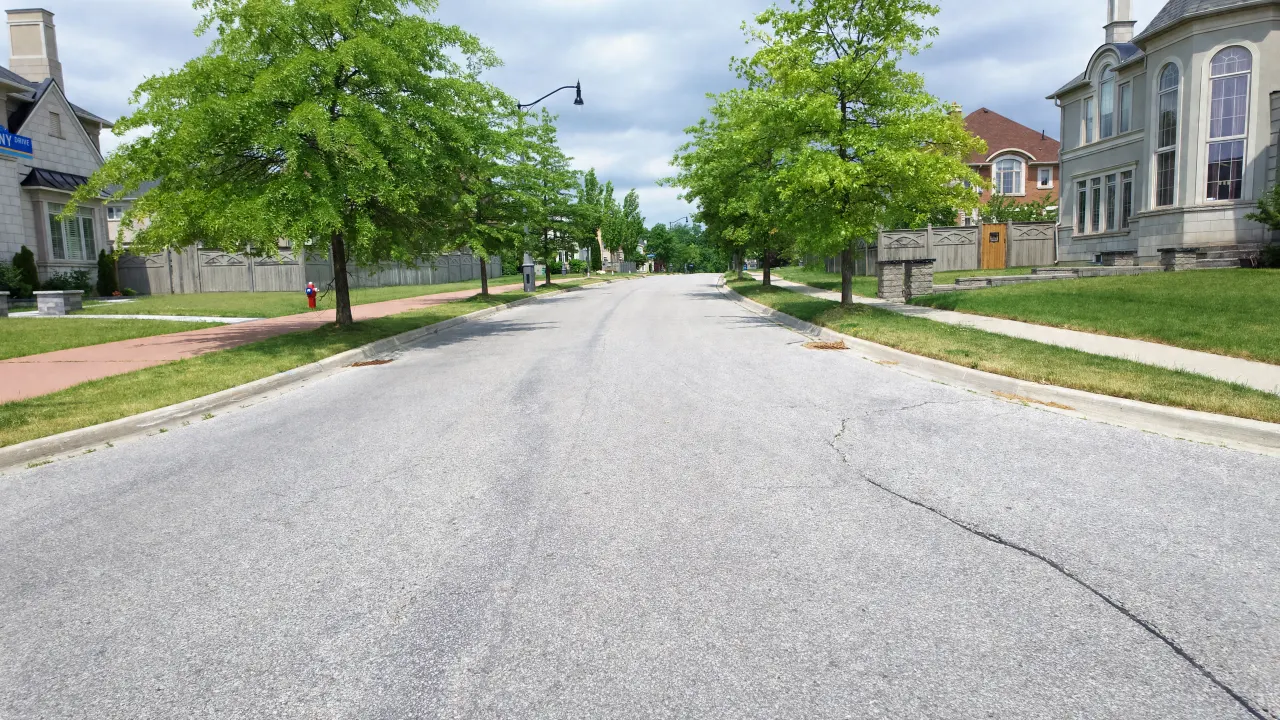
  • Road Type Local road, 2 lanes A residential street that mainly serves the homes on it
  • Length in the Neighbourhood About 410 m
  • Speed Zone 40 km/h Neighbourhood Safety Zone Most of this street is inside the City's 40 km/h zone
  • Sidewalks One side For most of its length, from the City sidewalk map
  • Street Lights 11 City light poles

Contains information from the City of Brampton, including information licensed under the Open Government Licence – City of Brampton. Source: City of Brampton: Brampton Plan Schedule 3C Streets Network (CC BY 4.0); City of Brampton: Street Light Poles (CC BY 4.0); City of Brampton: Sidewalks (topographic, last updated 2022) (CC BY 4.0); City of Brampton: Traffic Calming (40 km/h Neighbourhood Safety Zones, Speed Cushions). Lengths and counts are measured from City map layers and are approximate.

City Parcel Data

Lot Sizes on Cannington Crescent

Most lots on Cannington Crescent are about 50 ft wide (23 of 35 measured). 4 are about 40 ft, 3 are under 36 ft, 3 are about 60 ft and 2 are over 65 ft. 7 lots are pie-shaped, all on the outside of a bend. 3 are corner lots.

  • Typical Frontage About 50 ft Median about 50 ft across 35 lots
  • Typical Lot Area About 6,310 sq ft Median, about 586 m², about 115 ft deep
  • Lot Shapes 7 pie-shaped, 3 corner, 1 wedge Pie-shaped lots are narrow at the street and wider at the back 1 lot on the inside of a bend is wider at the street than at the back

Contains information from the City of Brampton, including information licensed under the Open Government Licence – City of Brampton. Source: City of Brampton: Residential Parcels (Additional Residential Unit search map); City of Brampton: Streets (centrelines) (CC BY 4.0). Approximate, measured from City parcel boundaries. Frontage is the length along the street line (the shorter street side on corner lots). Not a survey; check the survey or deed for any one home.