Estates of Credit Ridge Market Intelligence
Not estimates. Not Brampton board averages. 15 years of recorded sales from Estates of Credit Ridge, from the first homes sold in 2011 through Oct 2026. Prices, volume, days on market, and what the trends actually mean.
Data current through Oct 2026 · refreshed as new TRREB sales are recorded
Current Market Snapshot: 2026 YTD
Where Estates of Credit Ridge stands through Oct 2026, based on 39 recorded TRREB sales. With a sample this small early in the year, the median is the more honest centre than the average. Updated as new data becomes available.
All data sourced from the Toronto Regional Real Estate Board (TRREB) and compiled by Harpreet Sandhu for this site. Reflects freehold residential sales recorded in the Estates of Credit Ridge area. Dataset covers Dec 2010 - Oct 2026 (1,098 parsed sales). 2026 is a partial year (9 months, 39 sales).
The early-year signal is measured competition.
Through Oct 2026, Estates of Credit Ridge has 39 recorded sales, a $1.48M average sold price, 23 median days on market, and 5 sales above asking. This is the current read on the neighbourhood before you dig into the historical charts below.
Interactive Market Dashboard
Two views matter most: what prices did, and how much liquidity supported those prices. The charts are built from the same 1,098-sale TRREB dataset.
Price and liquidity tell the market story together.
Bedroom, kitchen and washroom filters are available to members. Log in or create a free account. Figures for groups of fewer than 5 sales are withheld to protect homeowners' privacy.
Slice the market by the features buyers actually compare.
This is the clearest first filter because the neighbourhood is overwhelmingly detached, but the non-detached sales behave differently enough that they should not be buried in a single average.
Bedroom values should be read as above grade plus below grade. A value like 4+2 means 4 bedrooms above grade, 2 bedrooms below grade, and 6 total bedrooms.
Below-grade bedroom count is the number after the plus sign in the bedroom field. A legal or functional basement bedroom changes buyer utility and rental or multigenerational appeal.
Total bedrooms is above-grade plus below-grade. That lets the page compare a 4-bedroom home to a 4+2 home without pretending they are the same product.
Two kitchens is a major signal. It often points to a second-suite style setup, multigenerational use, or a basement configuration that should be compared separately from a standard single-kitchen home.
Washroom count is a useful proxy for finished space, basement configuration, and renovation level when comparing otherwise similar homes.
Price Alone Misleads
The 2022 peak price looks powerful until paired with a sales-volume collapse. The neighbourhood did not have broad liquidity at the peak. It had fewer sellers and a smaller group of committed buyers.
Days on Market Shows Confidence
The 5-day median in 2021 tells a completely different buyer psychology story than the 21-day median in 2023 and the 23-day median in 2026. Speed is a cleaner signal than list price alone.
Sale-to-List Ratio Shows Leverage
At 103.8% in 2021, sellers controlled the negotiation. At 95.1% in early 2026, buyers are extracting concessions from list prices that would not have survived in hotter years.
What the 1,098 Sale Records Reveal
The Estates of Credit Ridge sales ledger has enough row-level history to look beyond averages. These views aggregate the full dataset by property type, bedroom count, price band, selling pace, month, and street. No individual addresses are shown.
Nearly 44% of all historical sales closed below $1M, but that is legacy inventory from the early years.
Most sales here still need time to find the right buyer.
Jun has the most sales volume across the full dataset, while Dec is the quietest.
Every Estates of Credit Ridge Street, Ranked
Each street with at least 3 recorded sales, with its full sales history aggregated. The highest-average streets are not always the highest-volume streets. Select a column heading to re-sort, or a street name to open its full guide.
| Astrantia Way | $2.08M | 9 | 12 days | 2025 |
| Adamsville Road | $2.02M | 16 | 11 days | 2026 |
| Annual Circle | $2.00M | 11 | 5 days | 2026 |
| Cachet Court | $1.86M | 11 | 13 days | 2024 |
| Agincourt Circle | $1.66M | 27 | 18 days | 2026 |
| Canis Street | $1.58M | 11 | 16 days | 2026 |
| Cannington Crescent | $1.58M | 19 | 14 days | 2026 |
| Deanston Court | $1.56M | 7 | 11 days | 2025 |
| Dalmeny Drive | $1.43M | 15 | 12 days | 2026 |
| Chilliwack Grove | $1.41M | 10 | 33 days | 2025 |
| Elbern Markell Drive | $1.38M | 51 | 18 days | 2026 |
| Haywood Drive | $1.37M | 27 | 23 days | 2025 |
| Chinzan Way | $1.35M | 10 | 13 days | 2026 |
| Ingleborough Drive | $1.33M | 22 | 11 days | 2025 |
| Louisburg Crescent | $1.33M | 11 | 17 days | 2022 |
| Franmar Road | $1.31M | 11 | 22 days | 2026 |
| Lampman Crescent | $1.31M | 17 | 18 days | 2025 |
| Fallowfield Road | $1.30M | 18 | 19 days | 2026 |
| Flanders Road | $1.29M | 10 | 16 days | 2026 |
| Lost Canyon Way | $1.29M | 9 | 9 days | 2021 |
| Perfection Court | $1.27M | 8 | 10 days | 2024 |
| Island Grove | $1.27M | 24 | 20 days | 2026 |
| Jewelville Street | $1.23M | 9 | 6 days | 2023 |
| Beacon Hill Drive | $1.19M | 39 | 22 days | 2026 |
| Interlacken Drive | $1.19M | 39 | 19 days | 2026 |
| Royal West Drive | $1.18M | 86 | 29 days | 2026 |
| Maybeck Drive | $1.17M | 21 | 17 days | 2026 |
| Impulse Circle | $1.16M | 33 | 14 days | 2026 |
| Pathway Drive | $1.16M | 26 | 10 days | 2025 |
| Merrittonia Street | $1.14M | 11 | 24 days | 2026 |
| Bear Run Road | $1.11M | 44 | 13 days | 2026 |
| Intrigue Trail | $1.11M | 38 | 14 days | 2026 |
| Lavallee Crescent | $1.10M | 30 | 12 days | 2024 |
| Pine Island Way | $1.10M | 16 | 14 days | 2026 |
| Ivanhoe Court | $1.09M | 14 | 23 days | 2024 |
| Fort Williams Drive | $1.09M | 12 | 20 days | 2024 |
| Black Diamond Crescent | $1.08M | 32 | 22 days | 2025 |
| Creditview Road | $1.08M | 20 | 22 days | 2023 |
| Deseronto Street | $1.07M | 19 | 20 days | 2026 |
| Jevins Close | $1.07M | 17 | 19 days | 2021 |
| Hosta Street | $1.04M | 10 | 19 days | 2024 |
| Balin Crescent | $997K | 27 | 19 days | 2025 |
| Lorenville Drive | $981K | 14 | 13 days | 2026 |
| Junetown Circle | $951K | 57 | 20 days | 2026 |
| Montreal Street | $944K | 11 | 12 days | 2024 |
| Beachville Circle | $688K | 101 | 14 days | 2026 |
| Calstock Place | – | 4 | – | 2026 |
| Crocus Street | – | 3 | – | 2022 |
| Innismoor Road | – | 3 | – | 2016 |
Streets with fewer than 3 recorded sales are excluded to reduce one-off sale distortion. Street-level data is shown only as aggregates, with no individual addresses or transactions. Default sort: highest average sold price.
Year-by-Year Breakdown: Full History
Every year since the neighbourhood's first sales in 2010. Prices, volume, pace, and competitive intensity from inception to present. 2026 is a partial year (through Oct 2026).
| Year | Sold Price avg / median | YoY Change | Sales Volume | Median DOM | Sale-to-List | Over Ask | Conditions |
|---|---|---|---|---|---|---|---|
| 2010 (1 sale) | – | Inception | 1 sale | – | – | – | Neighbourhood opens |
| 2011 | $636,039 $645,000 median | +8.5% | 36 sales | 23 days | 96.6% | 2 / 36 | New construction, early sales |
| 2012 | $680,460 $690,000 median | +7% | 68 sales | 38 days | 96.8% | 1 / 68 | Steady market |
| 2013 | $738,313 $741,500 median | +8.5% | 94 sales | 26 days | 97.2% | 3 / 94 | Steady market |
| 2014 | $773,154 $760,000 median | +4.7% | 99 sales | 17 days | 97.1% | 4 / 99 | Steady market |
| 2015 | $841,100 $813,500 median | +8.8% | 104 sales | 21 days | 97.4% | 10 / 104 | Steady market |
| 2016 | $1,012,099 $995,000 median | +20.3% | 85 sales | 13 days | 99.2% | 20 / 85 | Demand surge |
| 2017 | $1,199,309 $1,155,000 median | +18.5% | 85 sales | 8 days | 101.4% | 33 / 85 | Extreme seller market |
| 2018 | $1,199,859 $1,195,000 median | 0.0% | 59 sales | 16 days | 95.9% | 3 / 59 | Steady market |
| 2019 | $1,218,359 $1,212,500 median | +1.5% | 80 sales | 20 days | 97% | 12 / 80 | Steady market |
| 2020 | $1,348,478 $1,347,500 median | +10.7% | 92 sales | 16 days | 97.9% | 12 / 92 | Steady market |
| 2021 | $1,804,541 $1,757,375 median | +33.8% | 84 sales | 5 days | 103.8% | 52 / 84 | Extreme seller market |
| 2022 | $2,091,957 $2,100,000 median | +15.9% | 46 sales | 11 days | 99.7% | 22 / 46 | Price peak - volume collapse |
| 2023 | $1,919,990 $2,000,000 median | −8.2% | 35 sales | 21 days | 94.3% | 4 / 35 | Correction phase |
| 2024 | $1,677,047 $1,650,000 median | −12.7% | 43 sales | 16 days | 96.2% | 6 / 43 | Correction phase |
| 2025 | $1,626,815 $1,517,500 median | −3% | 48 sales | 17 days | 95.8% | 6 / 48 | Steady market |
| 2026 YTD (February-October) | $1,476,767 $1,465,000 median | −9.2% | 39 sales | 23 days | 95.1% | 5 / 39 | Correction phase |
2026 Month-by-Month
Small monthly sample sizes mean individual high or low sales move the average significantly - treat monthly figures as directional, not definitive.
Source: Toronto Regional Real Estate Board (TRREB). YoY change calculated against prior full-year average. Over ask means sold price is greater than list price. 2010 had 1 recorded sale; 2011 is used as the practical inception baseline.
The Story Behind The Numbers
The numbers only make sense with context. Here's the story behind each phase of the market.
The Formation Years: Steady, Unremarkable Growth
The neighbourhood's first full resale market years were defined by consistency. The neighbourhood was still completing - builders like Cachet, Minto and Eden Oak were delivering new homes throughout this period, which meant the resale market operated alongside a new construction pipeline. Buyers had choices. Competition was real but measured.
The average sold price moved from $636,039 in 2011 to $841,100 in 2015 - a 32.2% cumulative increase over four years. This wasn't speculative froth; it tracked closely with GTA-wide appreciation during the same period. Days on market ranged from 17 to 38 days. Sale-to-list ratios stayed in the 96-98% band throughout.
Volume peaked in 2015 at 104 sales - the highest single-year count in the full dataset. Resale here was now a functioning neighbourhood market, not a builder's sales program.
The Breakout: $1M Crossed, Then the Over-Ask Era Begins
2016 is the first watershed year in the neighbourhood's history. The average sold price jumped +20.3% in a single year - from $841,100 to $1,012,099 - crossing the $1M mark for the first time. Days on market collapsed from 21 to 13. 20 of 85 sales closed above asking price.
Then 2017 happened. Prices surged another +18.5% to $1,199,309. More significantly, 33 of 85 sales closed above asking price. The 8-day median DOM is the critical signal: buyers were not deliberating. The sale-to-list ratio hit 101.4%.
Ontario's Fair Housing Plan (April 2017), which included a 15% Non-Resident Speculation Tax, briefly interrupted momentum in the spring. The market absorbed it by fall, but it marked the beginning of the end of the unbroken ascent - setting up 2018's correction.
The First Correction: B-20, Rate Hikes, and a Reset
2018 was the neighbourhood's first experience of a demand-side policy shock. The federal B-20 mortgage stress test, which took effect January 1, 2018, required buyers to qualify at the higher of their contracted rate or 5.25% - effectively removing a segment of buyers who had previously qualified. Simultaneously, the Bank of Canada was hiking its overnight rate (from 0.5% entering 2017 to 1.75% by October 2018).
The result was immediate and measurable. Sales volume fell from 85 to 59 - a 31% drop. Over-ask sales collapsed from 33 to just 3. The sale-to-list ratio retreated to 95.9%. Yet the average price barely moved - from $1,199,309 to $1,199,859. This is a characteristic pattern in Estates of Credit Ridge: volume absorbs shocks before price does.
2019 was a stabilization year. Volume recovered to 80 sales. Price nudged up +1.5% to $1,218,359. The market had digested the stress test and adjusted to the new rate environment.
A Market Interrupted, Then Accelerated
2020 began as a normal year for the neighbourhood and ended as the starting gun for everything that followed. COVID-19 shutdowns froze transactions in Q2 - but the underlying demand never left. When the market reopened in summer 2020, buyers returned with urgency. Remote work suddenly made square footage and neighbourhood quality the primary criteria, not commute time.
92 sales closed at an average of $1,348,478 - a +10.7% gain over 2019. The 97.9% sale-to-list ratio shows most buyers were still negotiating modestly, but the conditions that would drive 2021 were already in place.
The Year Buyers Lost Their Footing
2021 was the most extreme seller's market the neighbourhood has recorded. Homes sold in a median of 5 days. 52 of 84 sales - 62% - closed above asking price. The sale-to-list ratio hit 103.8%, meaning buyers weren't just paying asking, they were routinely offering $50,000-$100,000 over.
The average sold price jumped +33.8% year-over-year - from $1.35M to $1.80M. That is not appreciation; that is a repricing event. Competing offers, record-low borrowing costs, a buyer pool that had accumulated savings through COVID and was aggressively chasing limited supply.
Peak Prices, Then the Floor Dropped
2022 is the most important year to understand if you're trying to make sense of where prices here are today. The year started at or above 2021's pace - early Q1 listings were still generating multiple offers, and the average price hit an all-time high of $2,091,957.
Then the Bank of Canada moved. Starting March 2022, the BoC began one of the fastest rate-hiking cycles in Canadian history - the overnight rate went from 0.25% to 4.25% by year-end. The psychological shift was immediate. Competing offer situations evaporated. Days on market stretched. Sellers who had listed at peak expectations faced reduced offers or no offers.
The result: sales volume collapsed to 46 - the lowest full year in the entire dataset. Sellers who needed to sell, sold. Sellers who could wait, pulled listings. The $2.09M average reflects a highly filtered pool of committed sellers, not a stable market.
A Slow Year With a Real Price Signal
2023 was the adjustment year. The average sold price fell to $1,919,990 - a −8.2% change from 2022. Volume hit 35 sales. The median days on market extended to 21 days - a clear signal that buyers were being more selective and patient.
The sale-to-list ratio of 94.3% is particularly telling. Sellers were listing with hope, and buyers were negotiating. For long-term holders, 2023 confirmed what the data always implied - the 2021 gains weren't permanent, but prices here weren't in free fall either.
Finding a Floor, Then Moving With It
2024 brought the first meaningful rate relief. Volume recovered to 43 sales, days on market tightened to 16, and the sale-to-list ratio improved to 96.2%. Average prices settled at $1,677,047 - −12.7% from 2023.
2025 continued that pattern: $1,626,815 average, 48 sales, 17-day median DOM, 95.8% sale-to-list. The neighbourhood was not in a frenzy and not in distress. It was a functioning premium market where pricing discipline matters.
A Cautious Start, and a Signal Worth Watching
Through Oct 2026, Estates of Credit Ridge has recorded 39 sales at an average of $1,476,767 - −9.2% from 2025's full-year average. The headline number from this early data isn't the price: it's that 5 of the 39 sales closed above asking price.
What this means practically: sellers need to price to the current market, not 2025 comparables. Buyers have more negotiating leverage than they've had in a long time.
What This Means Right Now: Oct 2026
The 2026 data is early but directional. Here's the honest read for buyers and sellers.
If You're Buying
The early 2026 data gives buyers strong negotiating leverage. 5 over-ask sales in 39 transactions means you're not walking into competing offer situations right now. A 95.1% sale-to-list ratio suggests below-list offers are reasonable on homes that have been sitting.
The neighbourhood's long-term price trajectory - +155.8% from inception to 2025 - includes two corrections (2018 and 2022) and recovered both times. The fundamentals haven't changed.
If You're Selling
This is the market where overpricing costs you the most. When buyers aren't competing, they're comparing - your home against every active listing in the neighbourhood. A price anchored to 2025 sold data may not hold in 2026 given the trending numbers.
Homes here that are priced correctly in 2026 are still selling. The market isn't broken; it's selective. Presentation, condition, and pricing are doing more work than they did in 2021-2022, when demand covered a lot of problems.
If you're thinking about listing: call before you list. A pricing conversation before the sign goes in is worth more than a price reduction three weeks later.
What Sells in Estates of Credit Ridge
The housing stock here is narrow by design - no condos, no high-rise. Here's what 1,098 transactions show.
92.5% Detached Homes
1016 of 1,098 recorded sales are detached single-family homes. The remaining records are mostly semi-detached (50) and freehold townhomes (31) along specific streets near the neighbourhood perimeter. No condo or high-rise units appear in the neighbourhood's transaction record.
71.7% Four-Bedroom Homes
Where bedroom count is populated, 4-bedroom homes (above grade) account for 71.7% of sales, so most homes that change hands here have four bedrooms or more above grade.
1,098 Sales Since 2011
That is about 73 sales a year across roughly 1,800 homes, so in a typical year only a small share of the neighbourhood comes up for sale.
Inception to Today: The Long View
The long view is what distinguishes Estates of Credit Ridge from most investment comparisons.
A buyer who purchased here at the 2011 average of $636,039 and held through 2025 saw their home value reach $1,626,815 - a gain of +155.8% over 14 years. That's through two separate correction events (2018 and 2022-2024), a pandemic, and two of the fastest rate-hiking cycles in Canadian history.
A buyer who purchased at the 2022 peak of $2,091,957 is holding an unrealized loss as of 2026. That's the real risk of buying at the top of any cycle. What the long-run data also shows is that the neighbourhood has recovered and continued appreciating after both previous corrections.
Key Price Milestones
- 2010: First resale in the neighbourhood at $586,000
- 2016: Average sold price crosses $1M for the first time
- 2017: Competitive over-ask year at 33 of 85 sales
- 2021: Average sold price crosses $1.80M, with 62% of sales over asking
- 2022: All-time peak at $2,091,957 - then rate shock
Seasonal Patterns
When Estates of Credit Ridge moves, and when it doesn't.
Spring (March - May)
Historically the most active window for the neighbourhood. Families looking to move before the next school year drive Q2 volume. Competition for well-presented homes near the neighbourhood schools peaks in April and May. In strong markets (2016, 2017, 2021), spring listings generated multiple offers within days.
Summer (June - August)
Volume softens as families shift focus to vacations and summer activities. Serious buyers who missed spring are still in the market, but competition is reduced. Jun has historically been the highest-volume month in the full dataset (129 sales across all years).
Fall (September - November)
A second active window, though typically smaller than spring. Buyers who lost out in spring re-enter after summer. September and October see solid activity. November begins to taper as families look to settle before the holidays.
Winter (December - February)
The quietest window by volume - Dec is the lowest-volume month in the full dataset (45 sales across all years). Listings are fewer, buyers are fewer, but buyers who are active in January-February tend to be serious and motivated.
From the Journal
Market guides
-
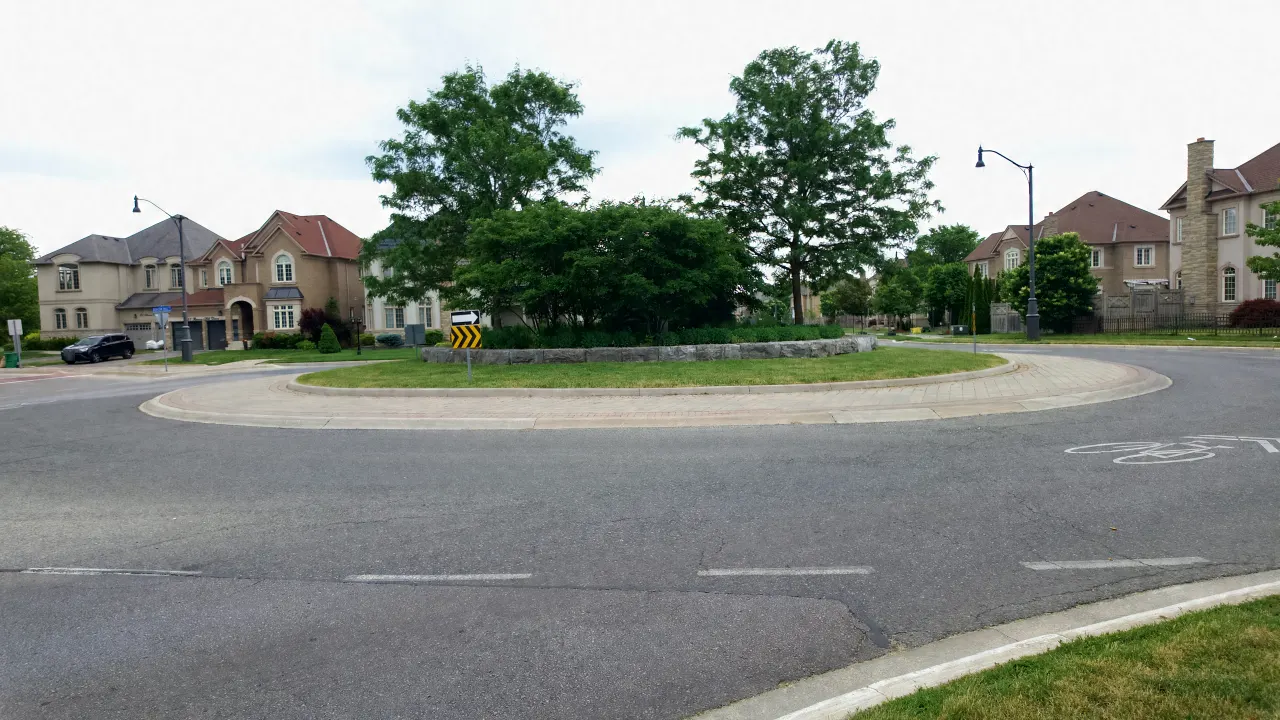 Market
Estates of Credit Ridge Home Prices Since 2011
Fifteen years of Estates of Credit Ridge prices: yearly sales, averages and days on market since 2011, with Harpreet's view of the...
-
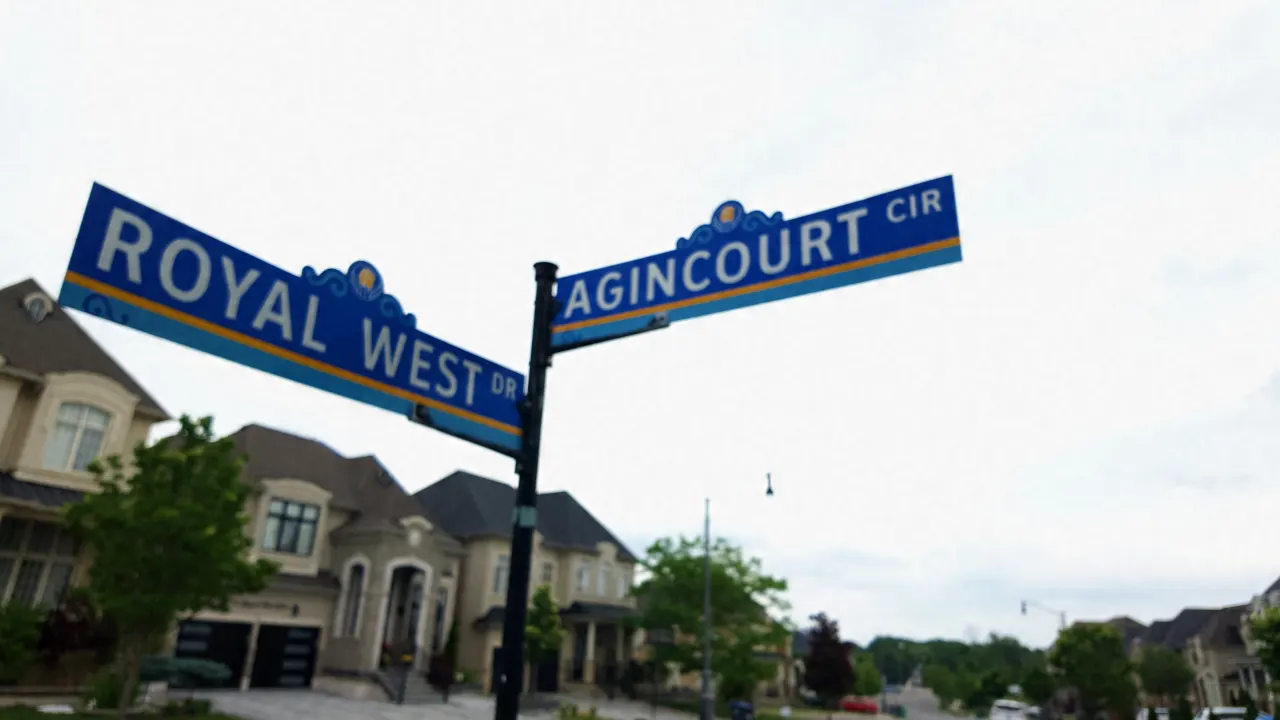 Market
When Estates of Credit Ridge Homes Sell: Seasonal Patterns
Which months Estates of Credit Ridge homes sell in: month-by-month and seasonal sales counts since the first resales, from neighbourhood data.
Want a Street-Level Read on Your Property?
Board averages don't tell you what your home on a specific street in Estates of Credit Ridge is worth right now. I'll pull the relevant comparables, walk you through the analysis, and give you a straight answer - no obligation, no pitch.