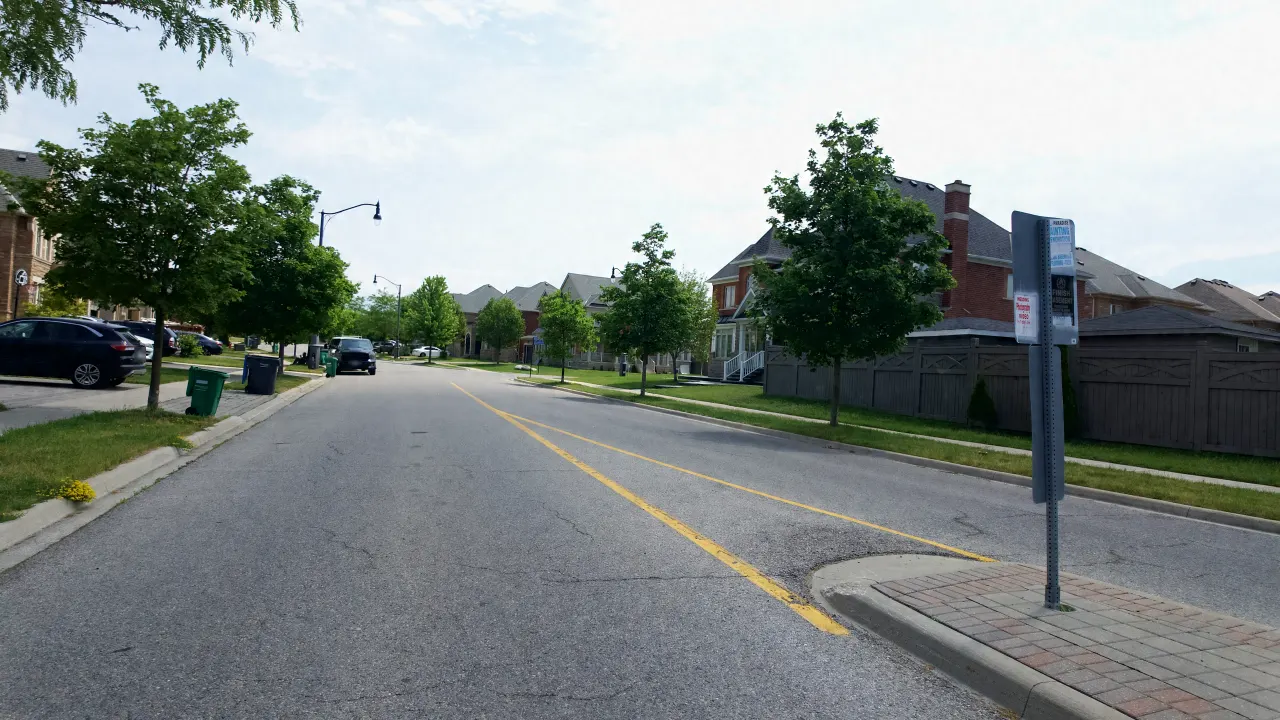
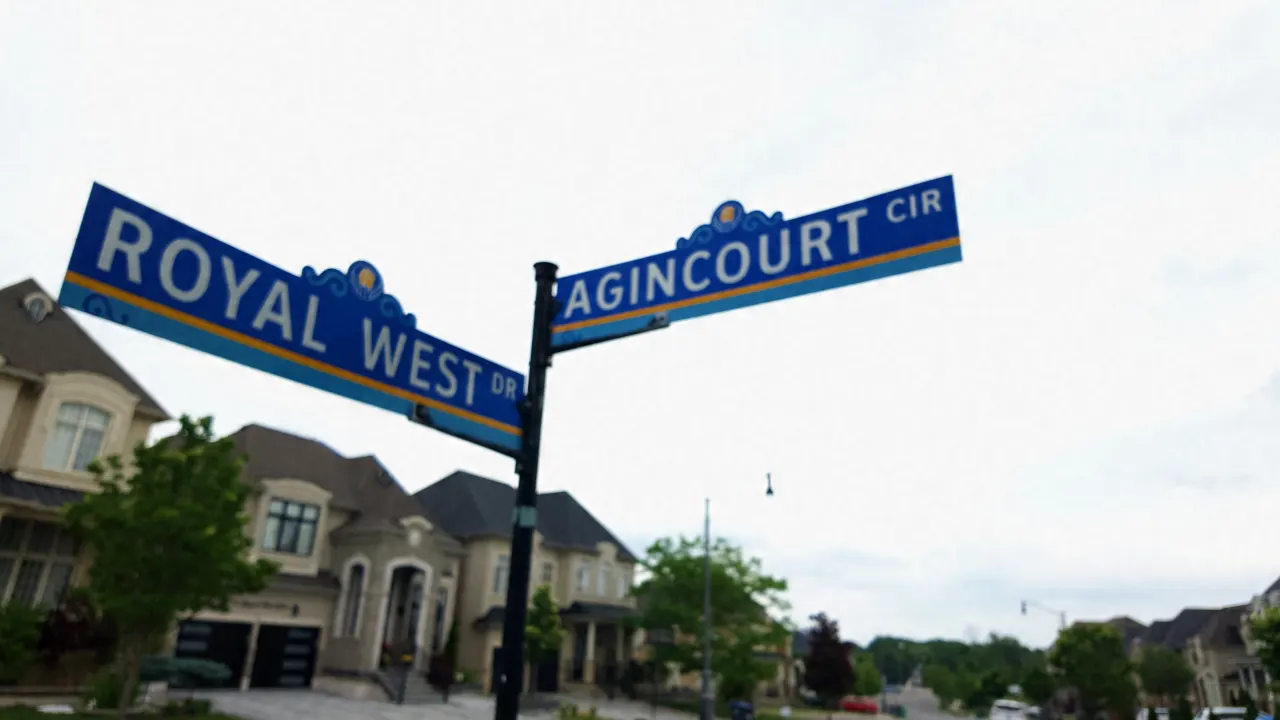
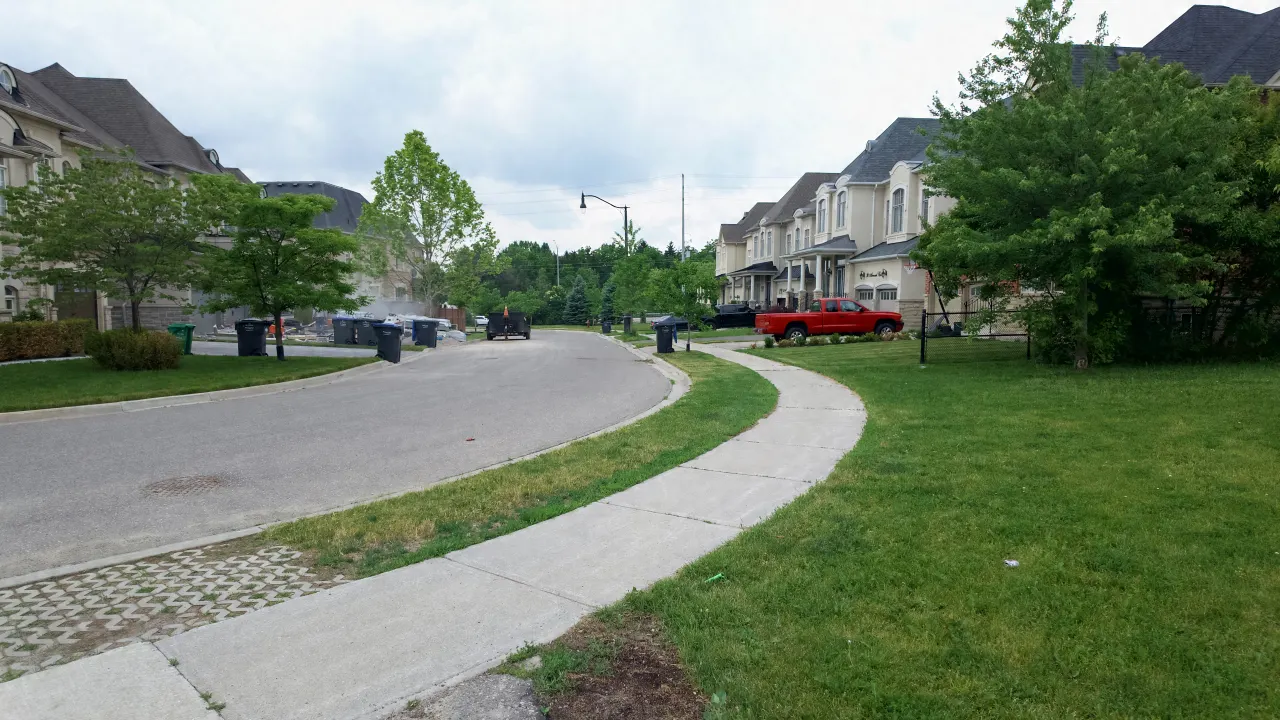
Estates of Credit Ridge Home Prices Since 2011
Fifteen years of Estates of Credit Ridge prices: yearly sales, averages and days on market since 2011, with Harpreet's view of the 2017 and 2022 peaks.

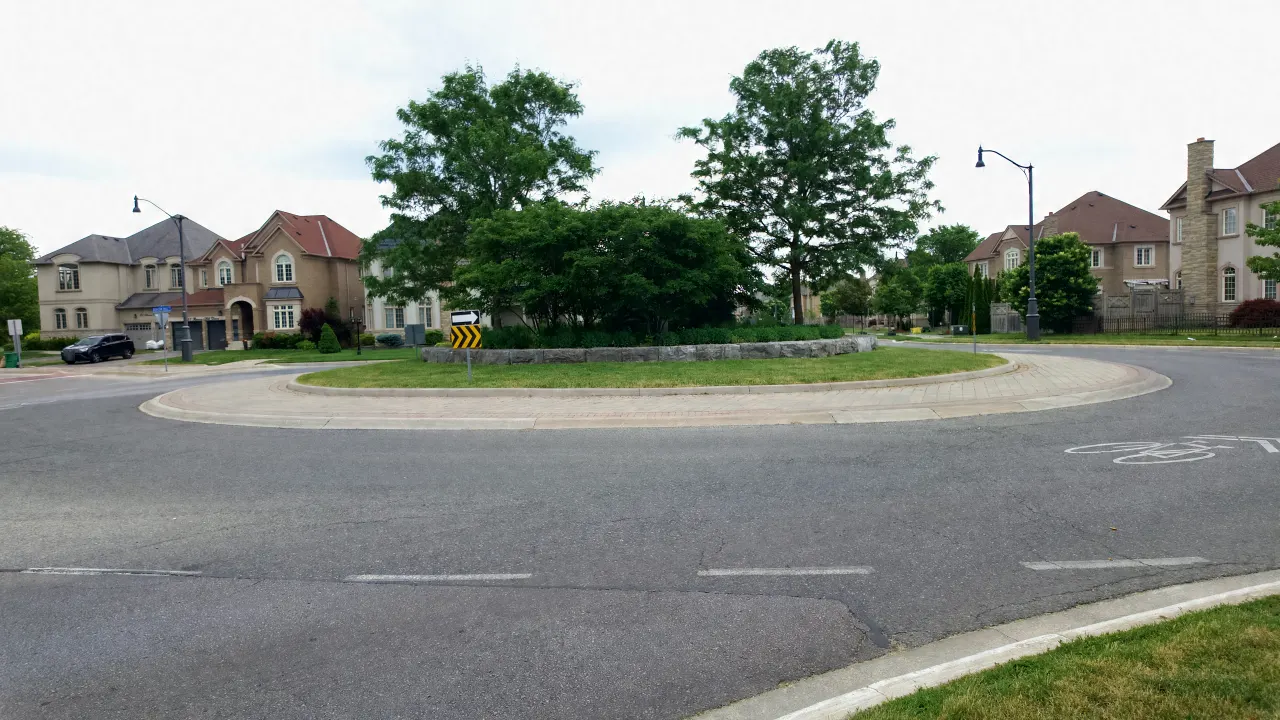
Estates of Credit Ridge now has about fifteen years of resale history, from the first resales while builders were still finishing streets to today’s balanced market. This post tells that story year by year, using the same anonymous sales aggregates that power our Market Data page, with Harpreet’s view of what drove each stretch. Every figure covers at least five sales, and no individual sale is shown.
How have Estates of Credit Ridge home prices changed since 2011?
Across 1,077 recorded resales from 2011 to June 24, 2026, the average Estates of Credit Ridge sale rose from $636,039 in 2011 to a high of $2,091,957 in 2022. In 2025, the most recent full year, the average was $1,626,815: 155.8% above 2011 and 22.2% below the 2022 high.
The averages below mix every kind of home that sold in a given year, mostly detached homes plus a smaller number of semi-detached homes and townhouses, so a year with more large homes sold can read higher than one with more smaller homes. Use them to see the shape of the market, not to value a particular house.
What drove prices up in 2016 and 2017?
Prices rose quickly in 2016 and 2017. The average sale climbed from $841,100 in 2015 to $1,012,099 in 2016 and $1,199,309 in 2017. In 2017, the median home sold in 8 days, homes sold for 101.4% of their asking price on average, and 33 of the year’s 85 sales closed above asking.
That run-up came as construction was wrapping up. By then most homes were built, families were moving in, and the neighbourhood was starting to look like the finished community buyers had seen on the site plans.
The 2017 peak was a natural rise in prices, plus demand for an established home. Construction was finishing around then: most homes were built and people were moving in.
Harpreet Sandhu, Real Estate Broker
Growth then slowed: the average sale was $1,199,859 in 2018, $1,218,359 in 2019 and $1,348,478 in 2020. The median home sold in 16, 20 and 16 days in those years.
Why did prices peak in 2022?
Prices then jumped. The average sale rose from $1,348,478 in 2020 to $1,804,541 in 2021, when the median home sold in 5 days at 103.8% of asking on average, and reached $2,091,957 in 2022, the highest yearly average recorded here. Fewer homes changed hands in 2022: 46, down from 84 the year before.
The 2021 and 2022 market was busy across the GTA. In Harpreet’s view, buyers who wanted a larger home in an established, planned neighbourhood in west Brampton had relatively few comparable choices, and that showed in how quickly homes sold.
As the market climbed, many people saw Estates of Credit Ridge as the luxury neighbourhood in west Brampton to settle and raise a family. Some homes sold for $3 million or more in 2022. It showed the demand for a neighbourhood like this.
Harpreet Sandhu, Real Estate Broker
What is the market like now?
In 2025, 48 homes sold at an average of $1,626,815, down 3.0% from 2024. The median home sold in 17 days, at 95.8% of its asking price on average. Through June 24, 2026, 19 homes had sold in 2026 at an average of $1,579,547.
Prices eased after the 2022 peak, homes took longer to sell than in the busiest years, and sale prices settled closer to, and often a little below, asking prices. That is a more balanced market for both sides.
Today it’s a nice, balanced market. In my opinion, if you compare a $1.5 million or $2 million home here with the other options at those prices, Estates of Credit Ridge is an obvious choice for those buyers.
Harpreet Sandhu, Real Estate Broker
Year by year: sales, prices and speed
The table shows every year with at least five recorded sales. The current year is partial and labelled with the date the data runs to.
| Year | Homes sold | Average price | Median price | Median days on market | Sale to list |
|---|---|---|---|---|---|
| 2011 | 36 | $636,039 | $645,000 | 23 | 96.6% |
| 2012 | 68 | $680,460 | $690,000 | 38 | 96.8% |
| 2013 | 94 | $738,313 | $741,500 | 26 | 97.2% |
| 2014 | 99 | $773,154 | $760,000 | 17 | 97.1% |
| 2015 | 104 | $841,100 | $813,500 | 21 | 97.4% |
| 2016 | 85 | $1,012,099 | $995,000 | 13 | 99.2% |
| 2017 | 85 | $1,199,309 | $1,155,000 | 8 | 101.4% |
| 2018 | 59 | $1,199,859 | $1,195,000 | 16 | 95.9% |
| 2019 | 80 | $1,218,359 | $1,212,500 | 20 | 97.0% |
| 2020 | 92 | $1,348,478 | $1,347,500 | 16 | 97.9% |
| 2021 | 84 | $1,804,541 | $1,757,375 | 5 | 103.8% |
| 2022 | 46 | $2,091,957 | $2,100,000 | 11 | 99.7% |
| 2023 | 35 | $1,919,990 | $2,000,000 | 21 | 94.3% |
| 2024 | 43 | $1,677,047 | $1,650,000 | 16 | 96.2% |
| 2025 | 48 | $1,626,815 | $1,517,500 | 17 | 95.8% |
| 2026 (to June 24) | 19 | $1,579,547 | $1,550,000 | 22 | 94.4% |
Source: Estates of Credit Ridge market data, TRREB residential sales via the Market Data page. Years with fewer than five sales are not shown.
How should you read these numbers?
Treat them as a neighbourhood trend, not a valuation. Each year’s average blends different home sizes, lot widths and conditions, and some years had fewer sales than others. Nothing here predicts future prices. To understand what a specific home might sell for, look at recent comparable sales on similar streets and lots.
For live figures by home type, see our Market Data page and monthly Market Updates. For timing within the year, see when Estates of Credit Ridge homes sell, and for the neighbourhood’s background, our history page.
Frequently asked questions
Do these numbers include every home type?
Yes. They include all residential resales recorded in the neighbourhood, mostly detached homes plus a smaller number of semi-detached homes and townhouses.
Why are some years missing?
We only show a year when at least five sales were recorded, so no single household’s sale can be read from the table.
Where can I see what a specific home sold for?
Registered members can see sold and leased records on our listings page. This post shows neighbourhood averages only.
Will prices go up because of Highway 413?
We do not make price predictions. Our post on Highway 413 covers what is actually planned.
Sources
- Estates of Credit Ridge market data: anonymous yearly aggregates of TRREB residential sales in the neighbourhood, via this site’s Market Data page; figures computed when this post was published; groups of five or more sales only.
- Harpreet Sandhu, owner notes on the 2017 and 2022 markets and today’s market (October 2026).